About Us
![]()
FeedTest provides independent, reliable and rapid fodder/feed analysis using state-of-the-art Near Infrared (NIR) Technology, that allows you to determine the nutritional value of your stockfeed products.
Key Services
- NIR Fodder Testing
- CNCPS Testing Services
- Wet Chemistry Testing
- Minerals Analysis
- Mycotoxins
- Pesticide Residues
- Prices
- Sampling Kits & Forms
- Season Averages
Latest News
Price Adjustment - 2025/26
FeedTest have conducted a detailed market analysis, and we would like to notify our clients of a...


About
Resources
FeedTest fact sheets or information sheets below will help you understand your FeedTest report better and with more clarity/detail.
Document links:
Understanding Your FeedTest Report - Summary
Protein & Energy content of some feeds
Mould & Yeast levels in Stockfeed
Terms and Conditions
By requesting any of the services from this division of AWTA Ltd, you acknowledge that you have read and agree to be bound by the Terms & Conditions for the provision of the services.
We may amend the Terms & Conditions at any time by notifying you, including in one or more of the following ways:
- printing the amended Terms & Conditions on our Test Request forms.
- referring to the amendments and/or printing the amended Terms & Conditions in a newsletter or Fees List.
- posting the amended Terms & Conditions on this website.
Your continued use of the testing services or consulting services after such notice and/or amendment will constitute acceptance of the variation.
Documents available for download:
By requesting any of the services from this division of AWTA Ltd, you acknowledge that you have read and agree to be bound by the Terms & Conditions for the provision of the services.
We may amend the Terms & Conditions at any time by notifying you, including in one or more of the following ways:
§ printing the amended Terms & Conditions on our Test Request forms.
§ referring to the amendments and/or printing the amended Terms & Conditions in a newsletter or Fees List.
§ posting the amended Terms & Conditions on this website.
Your continued use of the testing services or consulting services after such notice and/or amendment will constitute acceptance of the variation.
Documents available for download:
FeedTest Information
Seasonal Averages
The following tables show the mean and range of quality measurements for pasture hay, cereal hay, canola hay, legume hay, silage, and cereal grain over the last eight seasons.
AVERAGES - Concentrates 2023/24
AVERAGES - Silage & Fodder Beet 2023/24
AVERAGES - Concentrates 2022/23
AVERAGES - Silage & Fodder Beet 2022/23
AVERAGES - Concentrates 2021/22
AVERAGES - Concentrates 2020/21
AVERAGES 2018/19 - FIRST QUARTER
AVERAGES 2016/17 - FIRST QUARTER
AVERAGES 2015/16 - FIRST QUARTER
AVERAGES 2013-2014 - FIRST QUARTER![]()
AVERAGES 2012-2013 - FIRST QUARTER![]()
Please Note: This information is produced using data from FeedTest records, derived from samples as submitted by clients. FeedTest produces these tables for the information of clients merely to demonstrate the range in quality which can occur for a given type of feed.
Sampling Instructions
FeedTest will provide an accurate analysis of your sample however, it is vital that the sample is representative of the feed being tested, especially for hay and silage which can be highly variable.
Download the Sampling Instructions![]()
AFIA Grading System
AFIA, in conjunction with AQIS, are working together to enhance domestic and export trade requirements and regulations. Since incorporation, AFIA's achievements include the adoption of national hay grades (which are recognised by the National Agricultural Commodity Marketing Association NACMA), common quality testing methods, industry representation, adoption of Vendor Declaration Forms and industry communication.
With the need to align quality feed to quality livestock and milk production AFIA has initiated the use of Vendor Declaration Forms. These are made available free to members and provide a valuable tool to consumers by documenting the quality of product being supplied. This is one of the tools AFIA provides to boost confidence in fodder products.
The need for a common fodder description, language or grading system has been initiated by the AFIA.
The grades relate fodder quality (hay and silage) and to livestock performance and are based on objective measurements. They allow both buyer and seller to instantly recognise quality by means of a simple alpha-numeric code. The grade can appear on fodder analysis reports and on the Vendor Declaration Forms.
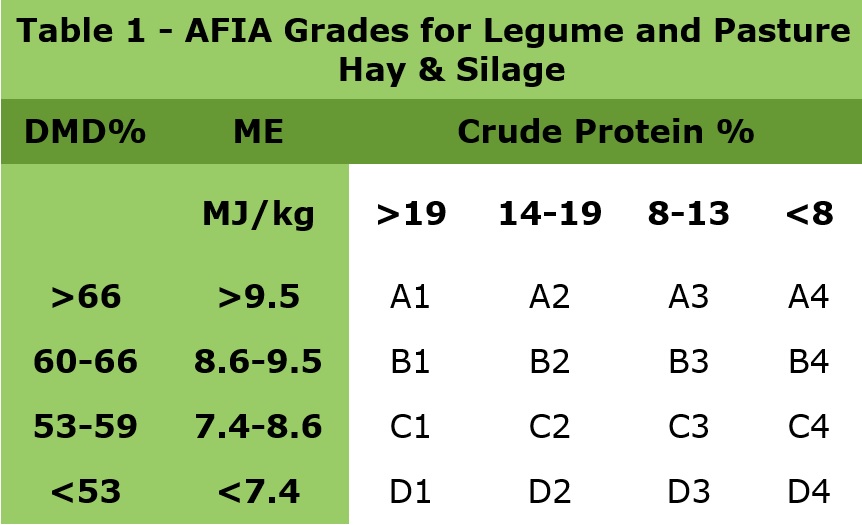
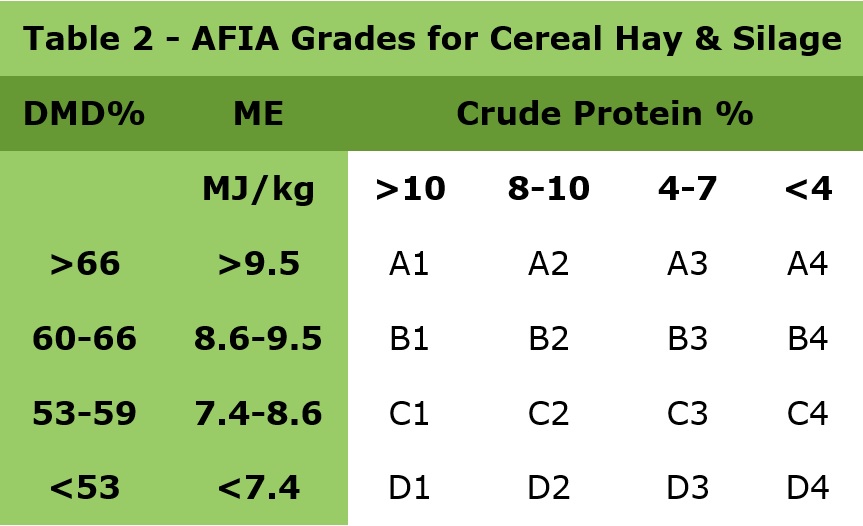
ME (MJ/kg DM) Metabolisable energy megajoules per kilogram of DM
DMD (%) Dry matter digestibility
CP (% of DM) Crude protein, % of DM
DM Dry Matter
Two separate grading systems have been adopted as shown in Table 1 and Table 2 above. These grades take account of the range in metabolisable energy and crude protein, which can occur in hay and silage and reflect the naturally lower protein content of cereal fodder.
Why FeedTest
This is a question we are often confronted with at FeedTest. There are many reasons why testing your stockfeed can be of great benefit.
FeedTest gives you the ability to develop economic feeding strategies.
Hay, silage and grain are used primarily in broad scale livestock enterprises as a supplement to achieve a particular outcome. That outcome may be minimisation of weight loss, maintenance of weight, weight gain, maintenance or improvement of milk production etc. Without some knowledge of the quality of the feed, a producer’s ability to predict the outcome is severely limited and assessment of success or failure is restricted to ‘after the event’ when it’s too late.
Some examples:
1. In our database we see a range in energy in oats of 8.8 MJ to 15.1 MJ. If we assume a protein percentage of 10, we can compare the performance of two oat samples of 9.5 ME and 12 ME in growing lambs. If the oats form the major part of the diet, the difference in growth between the two oats is 60 gms/hd/day versus 112 gms/hd/day respectively.
If we recognise these oats as deficient in protein for this purpose and can increase the protein to 16% and maintain the ME at 12, the growth rate will lift to 225 gms/hd/day.
Are you willing to pay the same price for the two oats?
2. If we feed beef steers silage and we look at the range of quality in our database (Protein 5% – 25% and ME of 7.2 – 11.2MJ) and select 10% and 16% as representative protein tests and 9.5 and 10.5MJ of energy we get a similar story.
| Protein (%) | ME (Mjoules/kgDM) | Growth rate (gms/hd/day) |
| 10 | 9.5 | 0.27 |
| 10 | 10.5 | 0.42 |
| 16 | 9.5 | 0.38 |
| 16 | 10.5 | 0.76 |
The level of production almost doubles with an increase of one unit of energy at the same protein level. The protein and energy level of the silage tells you a lot about your management of the silage both pre and post harvesting.
3. If we look at dairy cows fed the same silage as above as the sole ration, the comparisons are similar.
| Protein (%) | ME (Mjoules/kgDM) | Growth rate (kg/day) | Milk yield (kg/day) |
| 10 | 9.5 | -1.8 | 16.7 |
| 10 | 10.5 | -1.52 | 18 |
| 16 | 9.5 | -2.07 | 21.9 |
| 16 | 10.5 | -1.77 | 22.7 |
These figures demonstrate how important it is to know the feed value of your grain, hay or silage. This is true whether you buy the product or you grow it yourself.
4. An objective assessment of feed quality. Traditionally people used their own subjective methods to assess feed quality. How many times have you seen a farmer smell or taste hay or comment on its colour and then declare it good or bad?
Similarly, people often determine grain that is pinched to be of low quality based purely on appearance.
The truth is that such methods are unreliable. FeedTest has often conducted tests at field days where clients are asked to judge the highest quality bale of hay by appearance. Most get it wrong and are surprised by the results.
We use the latest NIR technology to rapidly and accurately test your sample.
5. A realistic basis for pricing feeds. Quality results have allowed the trade of feeds to be based on predetermined prices established for proteins or energies of certain levels. Knowing your energy value may result in improved marketing for your product and as a consequence higher prices may be obtained.
If you are a buyer, you want the best value for your money in terms of protein and energy content. Why pay top price for feed which may have little nutritional value.